In Part 2 of this blog series, we created an EventHub and a publisher to send Vehicle Stream data. We also created a consumer for testing our published messages. In this final post, we will look at Microsoft Stream Analytics and how it provide Out Of Box capabilities of processing EventHub data streams in real time.
Introducing Stream Analytics
Stream Analytics is Microsoft answer to real time event processing. It can be employed to enable Complex Event processing (CEP) scenarios (in combination with EventHubs) allowing multiple inputs to be processed in real time to generate meaningful analytics. Technologies like Esper and Apache Storm provide similar capabilities but with Stream Analytics you get an out of box integration with EventHub, SQL Databases, Storage, which make it very compelling for development in Microsoft Azure.
Moreover, it exposes a query processing language which is very similar to SQL 92 syntax, so the learning curve is minimal. In fact, once you have a job created, you can simply use the Azure Management portal to develop queries and run jobs eliminating the need to coding for most use cases. For more information on Stream Analytics refer here.
Let’s leverage Stream Analytics for the Event Hub scenario we development in the previous blog:
Creating a Stream Analytics job
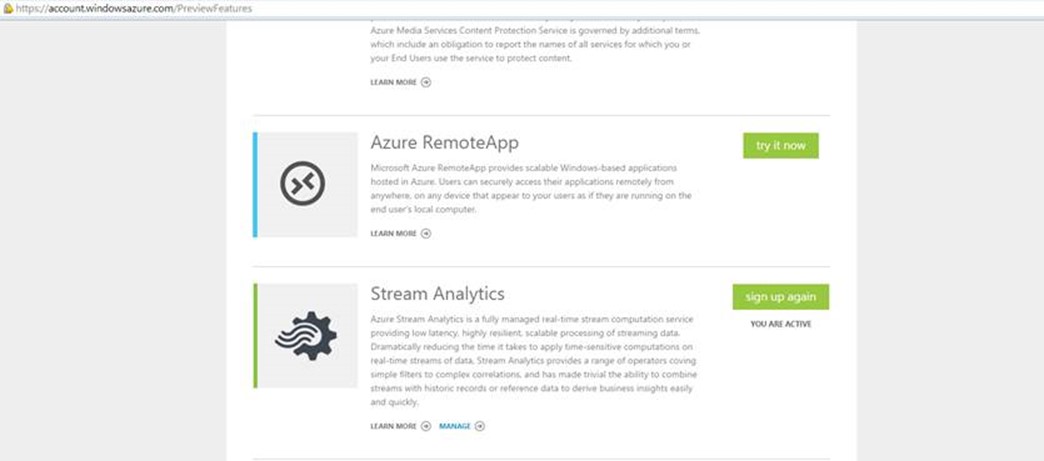
Stream Analytics is still in Preview so the first task is to enable it as a feature for your Azure Subscription.
For limitations of the preview release in creating job refer here.
To do this, login to your Azure subscription account administration. Select your subscription, then choose preview features, scroll down and Click “try it now” against the Stream Analytics option.
Once activated you should see a Stream Analytics extension in your management portal:

You can now start creating Stream Analytics jobs. A job in stream analytics allows you to define the inputs, query logic and outputs for a scenario.
- Click Create a new analytics Job to start the job creation template.
- Choose a unique job name
- Choose a Region, for the preview release Stream Analytics is only available in Central US and West Europe.
- Choose a monitoring storage account, this defines a storage account where Stream Analytics will capture monitoring and logging data. This does not refer to the storage account of the output from stream processing, you will specify that later.
-
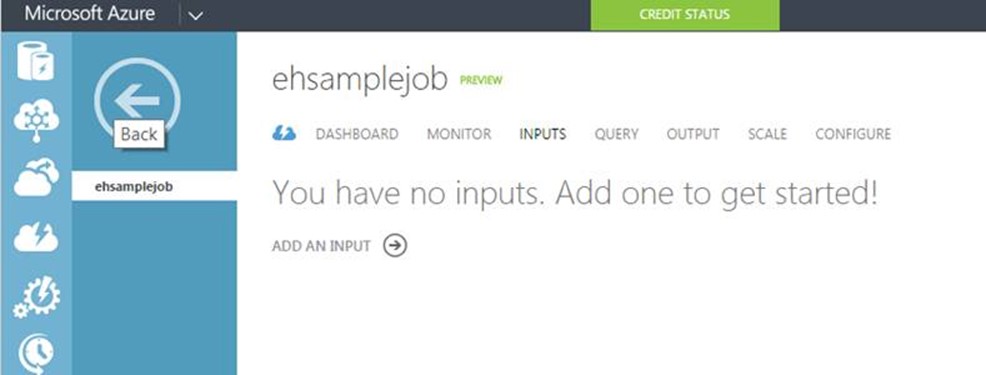
One your job is created, you should have a job that is in a Not Started state.

Defining Inputs
The next step is define Inputs for our job, Click on the job we just created and select Input -> Add an Input
There are currently two types of Input that can be added:
- Data Stream: This is the from where Stream Analytics will read data streams. The data stream can be an Event Hub or blob storage. Since an EventHub can ingest data from multiple clients (publishers), it is a preferred choice for real-time processing on IoT Devices. You may still use Blob storage if you have data populated in a persisted store, the data must have some of TimeStamp for features like Stream Analytics Windowing to be to be employed.
-
Reference data: This can be used to provide look up data like State, Countries, etc. Currently, this can only be a Blob storage account.
When building a query both inputs appear as dataset that you can include in your query.
For our scenario, we will use EventHub as the data stream:
-
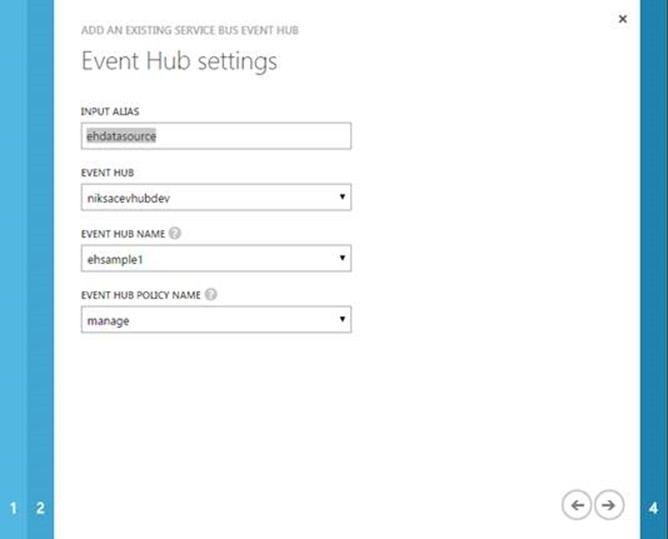
Click Add an Input, Choose Event Hub as the data stream option.

- In the EventHub settings, Provide an input alias as a unique value, this name will appear as a data source in the query window.
- From the EventHub dropdown, select the EventHub namespace that we created in Part 2 of this blog. You can also provide EventHub from a different subscription.
- Select the EventHub you want to use for ingestion
-
Select the EventHub policy, currently Stream Analytics requires the policy to have a Manage rule. If you don’t provide Manage permission, the query processing will fail later. Use the Manage permission for Event Hub that we created in the previous section. I really hope this will change so a granular permission can be specified.
-
Next, we specify the data serialization format. You can choose between JSON, Avro and CSV. Note that this is not the output format but the ingestion data stream format. I used JSON.NET to serialize my VehicleStream type before publishing so I will choose JSON here.

-
Click OK, The job will attempt to test connection by connecting to the EventHub. You should now see the status for the Input as Connected

Defining Output
Before we define a query, we will provide an output for our results
- Click the Output tab, Click Add an Output
-
Stream Analytics preview supports outputting the results in three formats:
- Blob Storage: push results into a blob storage container for permanent storage.
- EventHub: transfer results to another EventHub, this is useful where you want to create a pipeline architecture and the results of one processing needs to be the input for other.
- SQL Database: push the results into a database. This will create a new table in the database.
- Blob Storage: push results into a blob storage container for permanent storage.
-
Select Blob Storage, next, provide details of the storage account that should contain the output data. Ensure that you follow appropriate storage guidelines depending on the duration the job is going to run and that data that is going to be stored. You can also specify storage account from a different subscription.

-
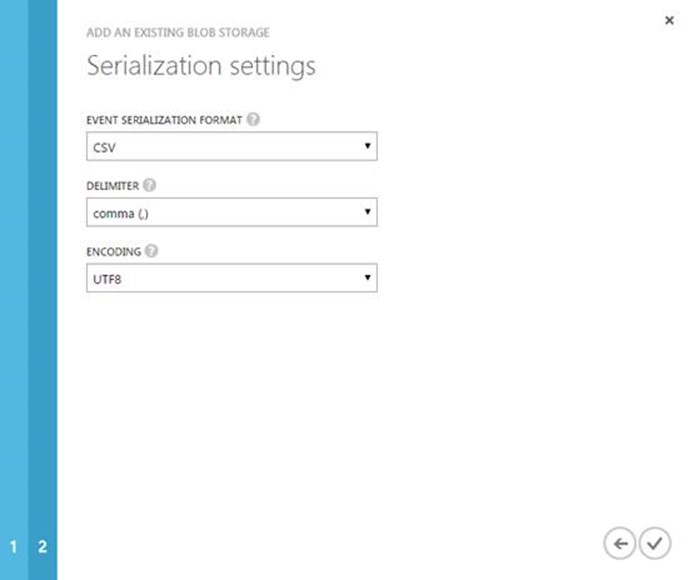
Finally, select the data output format. Supported formats are JSON, CSV, Avro. In this case we select CSV. The preview feature only support UTF 8 encoding.
-
Click OK. You have an Output available in Connected state.
Defining the Query
Now we come to the interesting part of Stream Analytics, as mentioned before Stream Analytics allows users to create SQL-like syntax for processing of ingestion data streams. The query language that enables this feature is the Stream Analytics Query language. Most of the syntax and constructs of SQL 92 are supported however there are some very interesting additions:
Windowing
As the name suggests, Windowing allows for processing data stream within a window of interval. It is mainly handling events that occurred on a slice of the timeline. Stream Analytics does the aggregation over the duration of the window specified. Windowing is always used in the GROUP BY clause.
There are three variations of Windowing that is supported:
- Tumbling: process events every n <unit of time>, do not overlap time intervals
- Hopping: process events for a windows size X <unit of time>, next time hop Y <unit of time> and then again process X <unit of time>. Example: start with processing 10 minutes of stream with a hop size of 5 minutes, next time processing will start from 5 minutes with a windows size of 10 so essentially next processing will be 5-15 instead of 0-10.
-
Sliding: process event that occurred during the time window X <unit of time>
For our scenario, we will create a query that will process based on the following business logic:
For the last five minutes, output the count all vehicles where average odometer reading is > 10000.
This can be used by dealers to determine which vehicles are due lease renewals.
Don’t worry if this condition sounds unrealistic, the idea here is to show the simplicity of query development in Stream Analytics, you can create more powerful use cases using the query language:
To define the query, we simply access the Query tab in the Management Portal to enter a query. The Query window itself is very similar to an SQL query window and provides basic syntax validation. It does not have features like running query for results at least today, you will have to execute the job to view the results.

Running our Job and results
Let’s recap what we have done until now, we created a new Stream Analytics Job and defined the Input, Output and Query to be processed. The next step is to run the job. This can simply be done by pressing Start on the Dashboard tab. This will verify the Input and Output connection and then also validate the Query before execution.

Once all validation are successfully completed, Stream Analytics will provide a status on the job. Your job is now reading incoming streams from the EventHub. Think of this as a consumer to your EventHub which will process all incoming data streams.

Now that we have a job running, the final step is to push some event data into the event hub to validate our results. I will use the Publisher that we created in Part 2 of this blog to publish messages on the EventHub. The publisher is a simulator which send event streams for different devices and also repeats status from already sent device to create a mix of incoming data streams.

If you now go and look at the Storage account and the Blob container we mentioned when configuring the Stream Analytics Output, you should see a CSV created. Opening the CSV provides us with the expected results.

Great, we now have real-time results getting processed from our device Telmetry!
If you want to monitor the requests being processed by the Stream Analytics job, you can view the Dashboard in Management Portal and you should see Input and Output events getting processed.

EventHub and Stream Analytics are really powerful techniques that can be used to create end-end IoT solutions. With the support of protocols like AMQP, Https you can cater a lot of new generation powered devices and use these technologies in conjunction to ingest telemetry data from a variety of clients. In case, your devices work on other custom protocol or protocol like MQTT you may still be able to create a front end (protocol head) that accepts request and then transforms the packet in AMQP. From that point onwards you can continue to use EventHub for ingestion and Stream analytics for real-time processing.
